
sigmaplot是一款专业性非常强的绘图软件,软件主要用于科学研究方面,可以对复杂的数据进行统计,并根据统计结果绘制出对应的图形内容,可以大大降低统计人员的工作量。KK下载站为您提供sigmaplot 中文破解版下载,软件已完成汉化破解,可以永久免费使用,有需要的朋友赶紧下载使用吧!
有超过100,000人使用此软件-专门为科学家设计,SigmaPlot允许你自己建立自己想要的特色,你可以插入多个横轴或竖轴,指定Errorbar的方向,等等。
使你的图画光彩夺目。
只要你用SigmaPlot绘制好,就可以连接到其他软件的展示,并且可以输出为EPS、TIFF、JPEG等图形格式,也可以上传到你的网站上。
对数据进行分析。
SigmaPlot提供从基础统计到高级数学计算等各种分析工具.构建100组方程序可以使您在做回归分析时得心应手.可结合Excel的分析功能.使用SigmaPlot正是如此简单.
自动化数据管理。
SigmaPlot的巨大指令可以自动地管理数据.节省了处理复杂数据的时间.并且可以立即将数据转换为图形.SigmaPlotOLE的功能可以与Word、Excel等其他应用软件无缝地连接起来.
SigmaPlot图库,你可能已经花费了很多时间来收集和分析数据.目的是制作一个一流的图表.使用的图形数据库很容易就能使你的图表看起来和专家一样出色。
创建一个解析网络图表。
SigmaPlot允许用户发布高解析的交互式曲线图和图表。
sigmaplot绘图软件安装教程
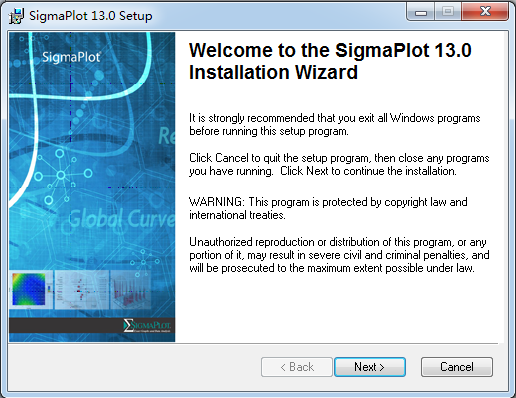
1.到本站下载安装Sigmaplot,打开安装程序,点击next继续安装
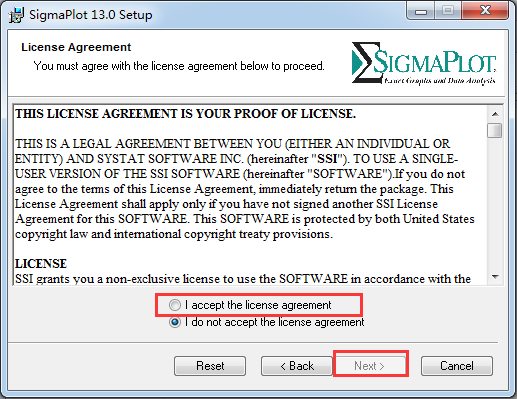
2.点击同意此协议,点击下一步
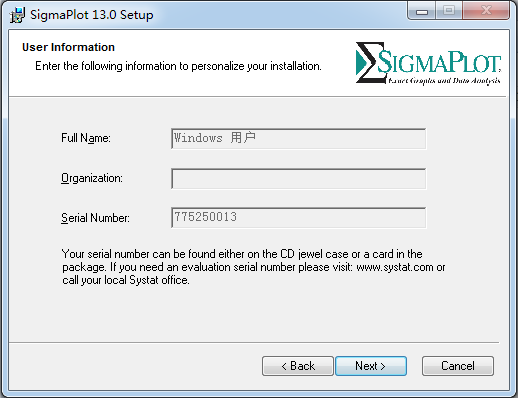
3.可以不用填写,直接next跳过
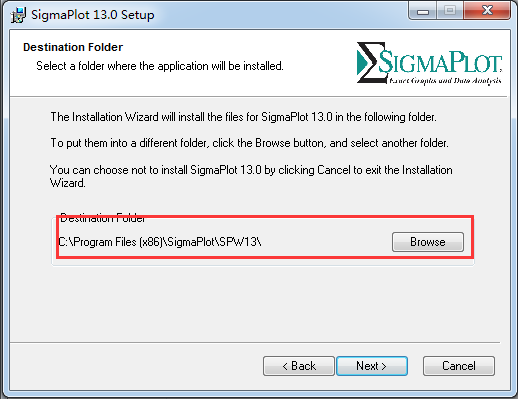
4.你可以默认软件安装位置,也可以点击browse选择安装位置
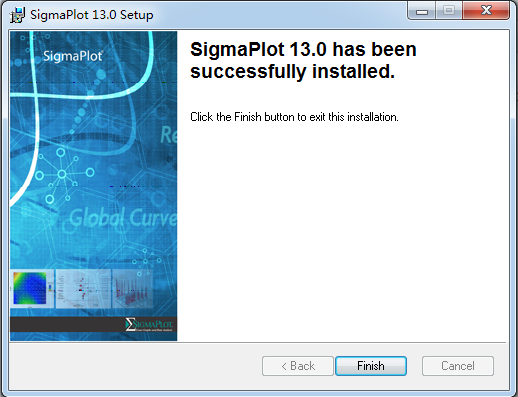
5.到这里,点击Finish即可安装成功
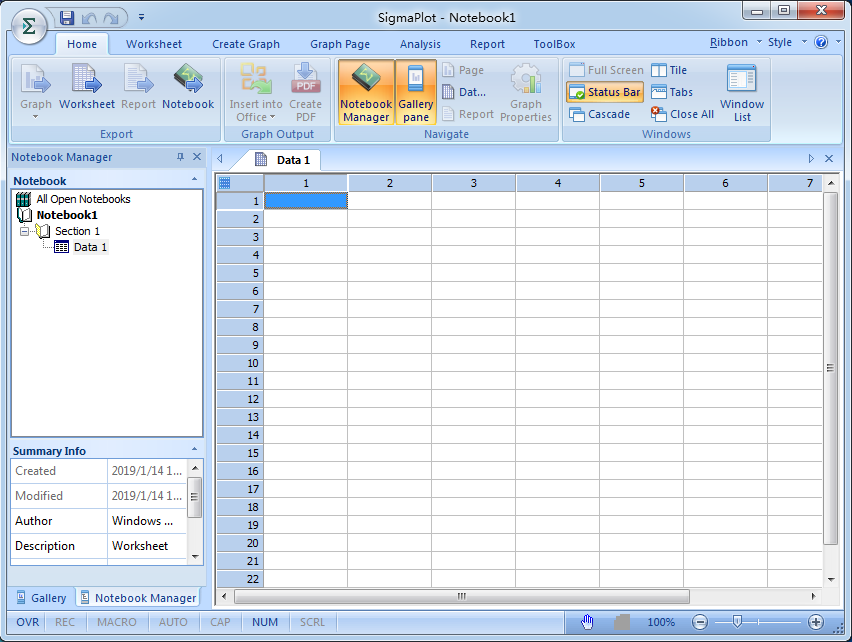
sigmaplot绘图软件使用说明
1.开启SigmaPlot,Open Excel,输入XY两组资料,一般来说Column A为X, Column B为Y
2.选择要画的图形,如Line Plot折线图,就会看到结果.
3.若您要更改设定,往图形中央快点两下,即会显示出参数设定视窗. 就是这么简单!
4.SigmaPlot的WebViewer能自动下载浏览器首先遇到的SigmaPlot 2001曲线图
sigmaplot绘图软件功能介绍
易于绘制精确的图形图形:有超过100,000人使用此软件-专门为科学家设计,SigmaPlot允许你自己建立自己想要的特色,你可以插入多个横轴或竖轴,指定Errorbar的方向,等等。
使你的图画光彩夺目。
只要你用SigmaPlot绘制好,就可以连接到其他软件的展示,并且可以输出为EPS、TIFF、JPEG等图形格式,也可以上传到你的网站上。
对数据进行分析。
SigmaPlot提供从基础统计到高级数学计算等各种分析工具.构建100组方程序可以使您在做回归分析时得心应手.可结合Excel的分析功能.使用SigmaPlot正是如此简单.
自动化数据管理。
SigmaPlot的巨大指令可以自动地管理数据.节省了处理复杂数据的时间.并且可以立即将数据转换为图形.SigmaPlotOLE的功能可以与Word、Excel等其他应用软件无缝地连接起来.
SigmaPlot图库,你可能已经花费了很多时间来收集和分析数据.目的是制作一个一流的图表.使用的图形数据库很容易就能使你的图表看起来和专家一样出色。
创建一个解析网络图表。
SigmaPlot允许用户发布高解析的交互式曲线图和图表。
 HTML代码转JS字符串工具
 万能看图王纯净版
 念青五笔输入法
 UPUPOO免费版
 Hwinfo64硬件检测工具
 BookStar电子书阅读器
 pyTranscriber
 Firealpaca(绘画软件)